چگونه انتخاب می کنید که چه چیزی شامل شود؟
Collecting visualizations for the Dispatch is mainly about clicking hundreds of promising links — sometimes so interesting it’s hard to not get sidetracked — closing a fair amount of them again, and carefully selecting which ones to keep. Publishing the Dispatch has given me the habit of saving any intriguing charts I come across during the week, be it through Reddit, LinkedIn, or friends that send me links knowing I’m the one who’s always interested in data vis.
Choosing is the harder part. We don’t have a fixed set of criteria but rely on a multiple-eyes process. If I’m not 100% certain about a visualization, I always have the security of discussing it with Rose. We all agree on certain principles for what makes a good visualization, but we highly value new approaches and ideas. The perfect bar chart might be a technically better visualization than an unusual and risk-taking project that takes longer to understand, but both are equally valid here. After all, an integral part of this format is sparking ideas in other creators.
When collecting material, we of course value aspects like legibility, good use of color and typography, and chart choices for the given data. Not everything needs to be perfect though — sometimes, a bit of a novel design may make a few sacrifices to present information in a more inspiring way. Accessibility and interactivity are also easy bonus points.
Every now and then, we discover an obviously outstanding project that is already more than a week old. The chance of missing thoughtful, less news-focussed work is a downside of publishing a weekly format, but we do our annual holiday special to make up for it.
In my mind, there are three ways a visualization can fit into the Dispatch: being technically flawless, conceptually thought-provoking, or capturing the state of the field this week.
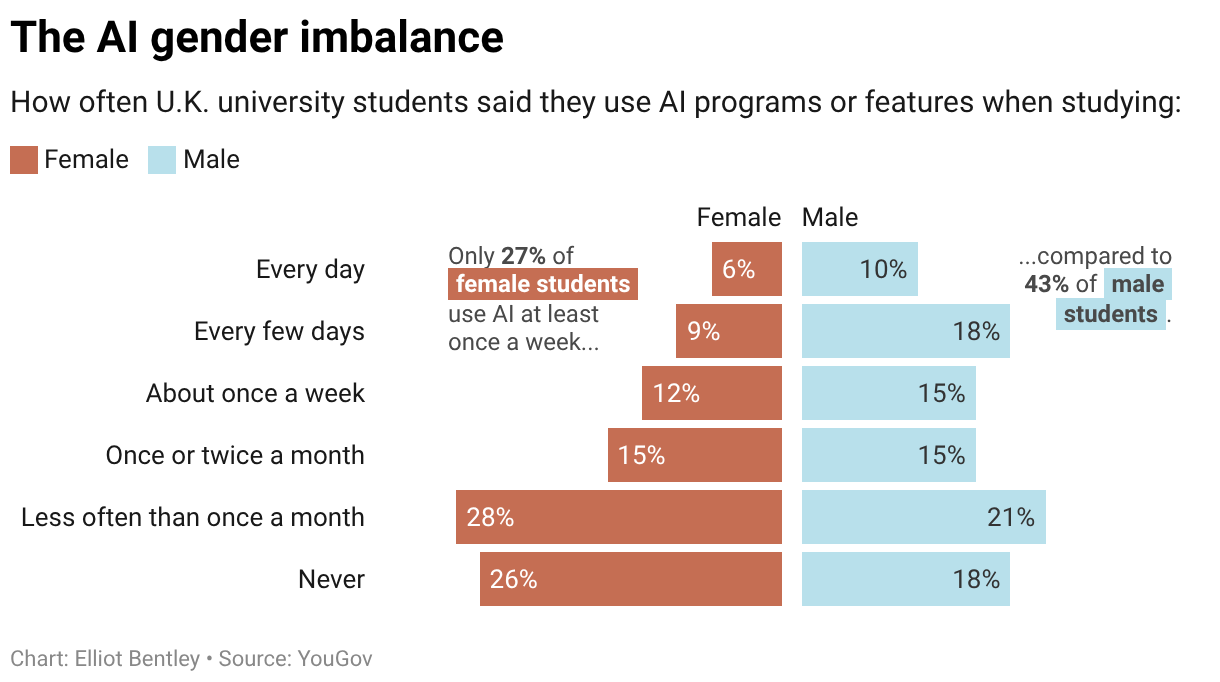
Charts in the Dispatch don’t need to be flashy — I’ll happily include a standard line chart on a mundane topic . But when we do show such a chart, it’s because it gets everything right. Elegant colors, perfect label placement, thoughtful annotations — the kind of visualization that really shows how it’s done.
On the flip side, we might show a chart with some rough edges if it takes an interesting and valuable conceptual approach. Does the chart type fit the data in a really elegant way, or use a powerful new visual metaphor to shake up an old topic? We can all learn from that!
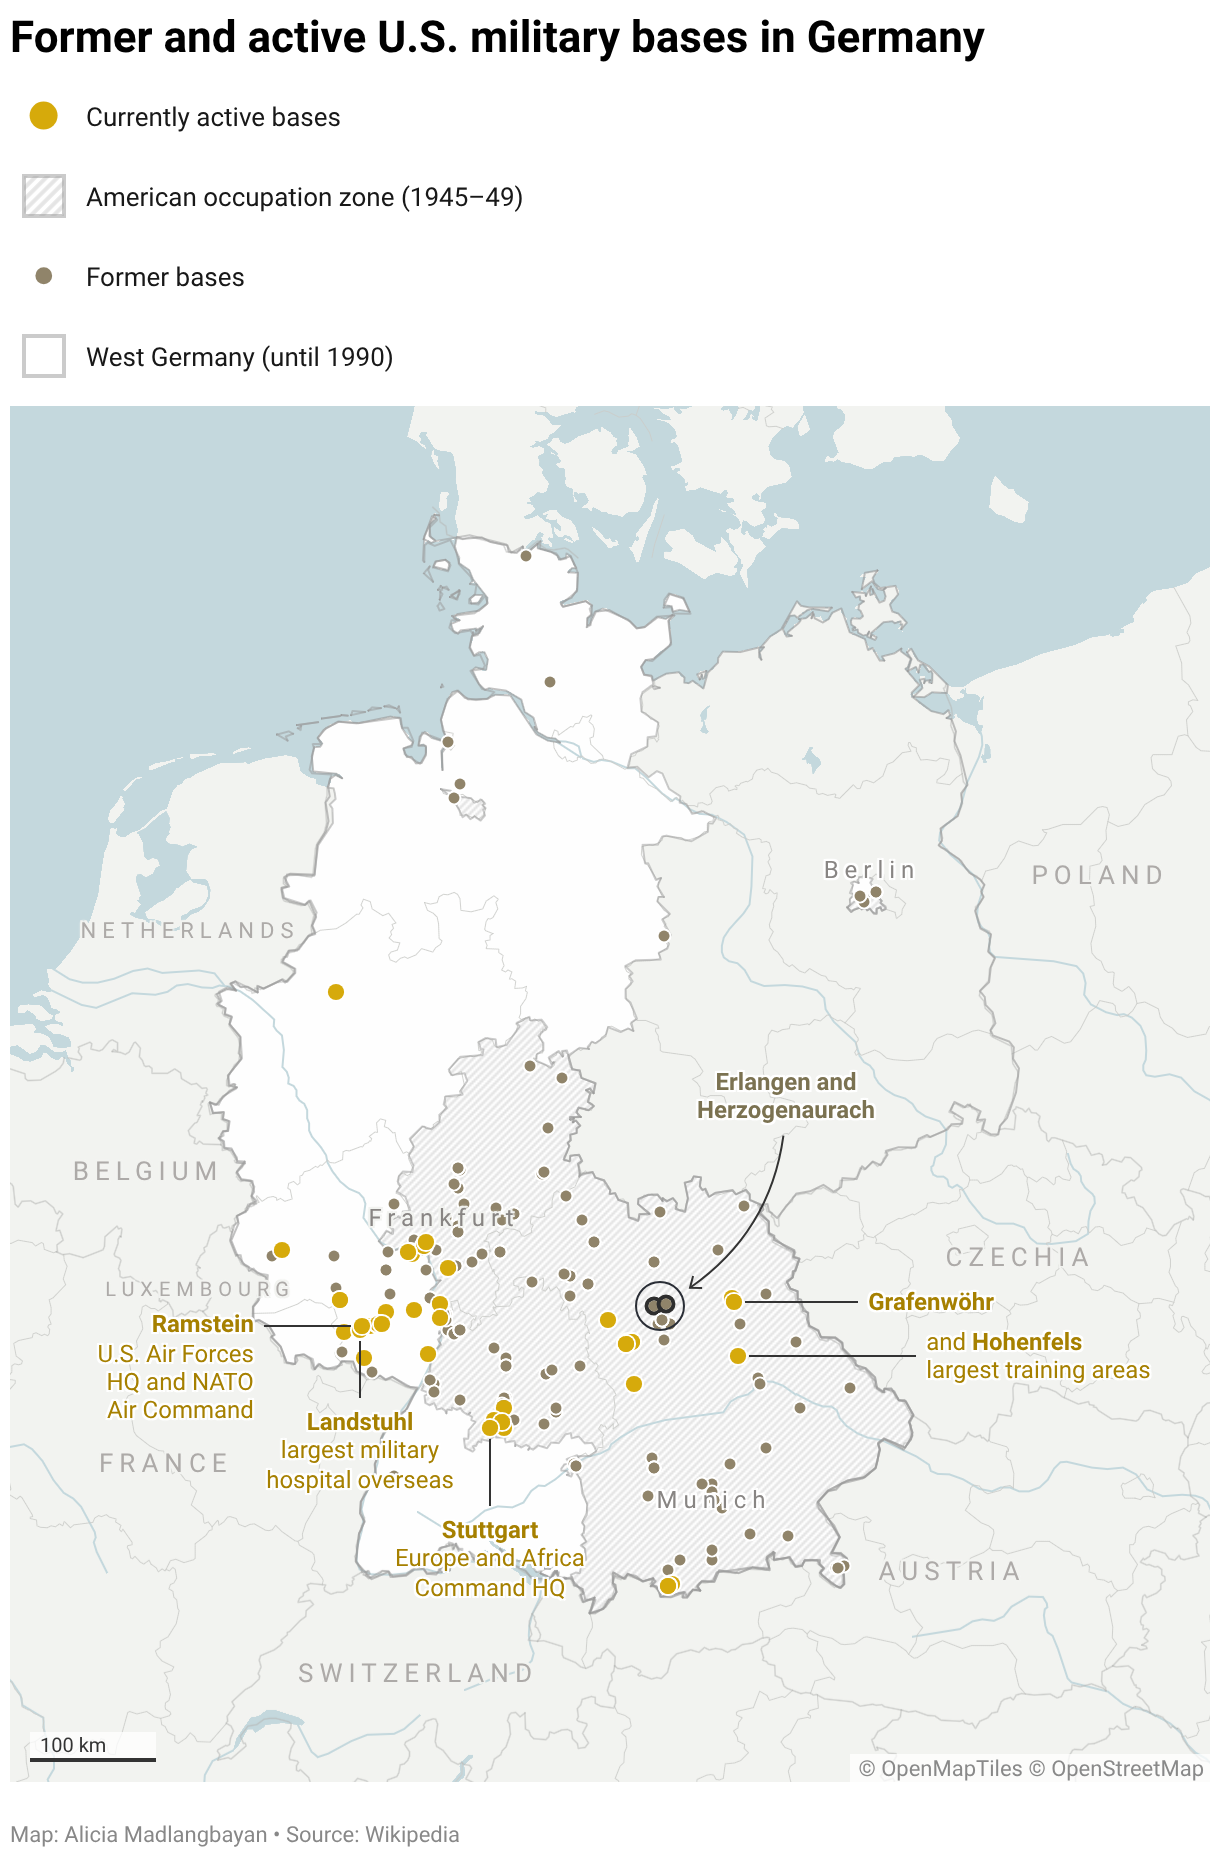
Finally, the Dispatch aims to capture what happened in the data vis world each week. We want to help readers stay on top of current trends and also create an ongoing archive of the field in these years. That means showing a broad cross-section of coverage for major news events — for example, how the same natural disaster was covered in newspapers around the world — sometimes even including work we might have passed over otherwise.