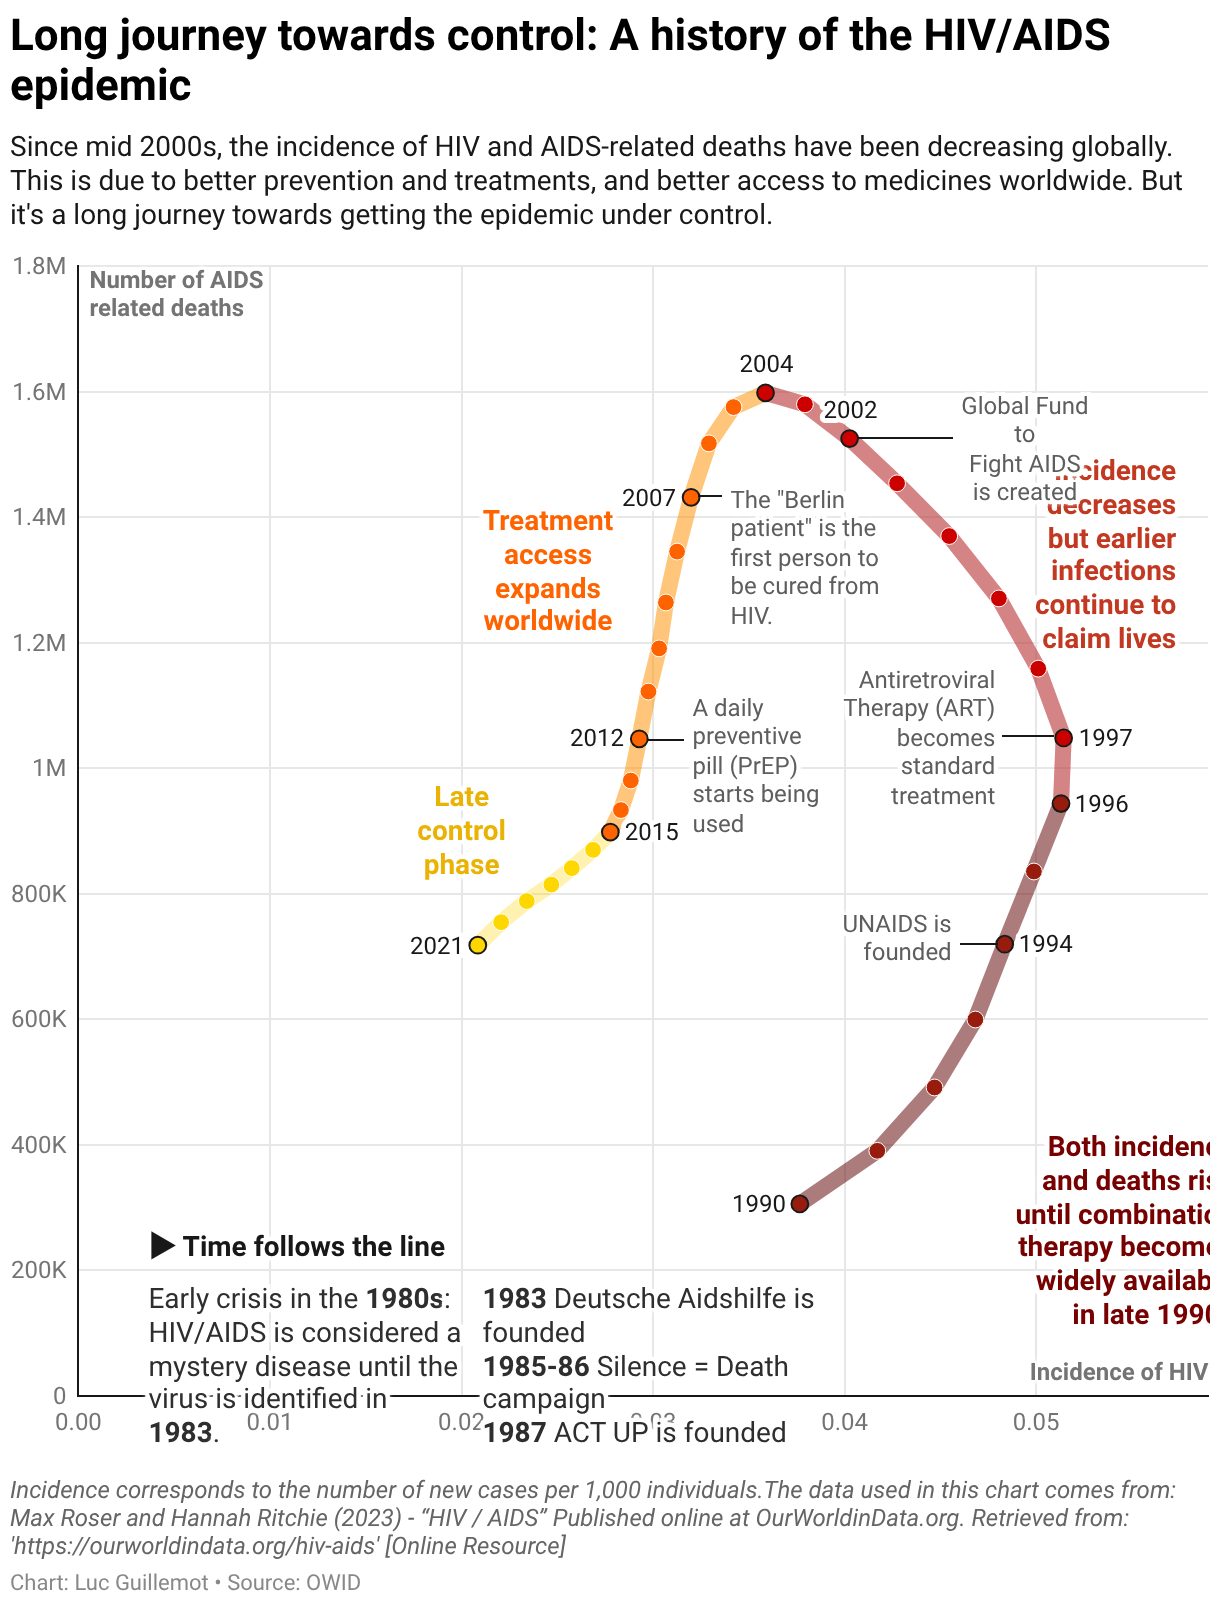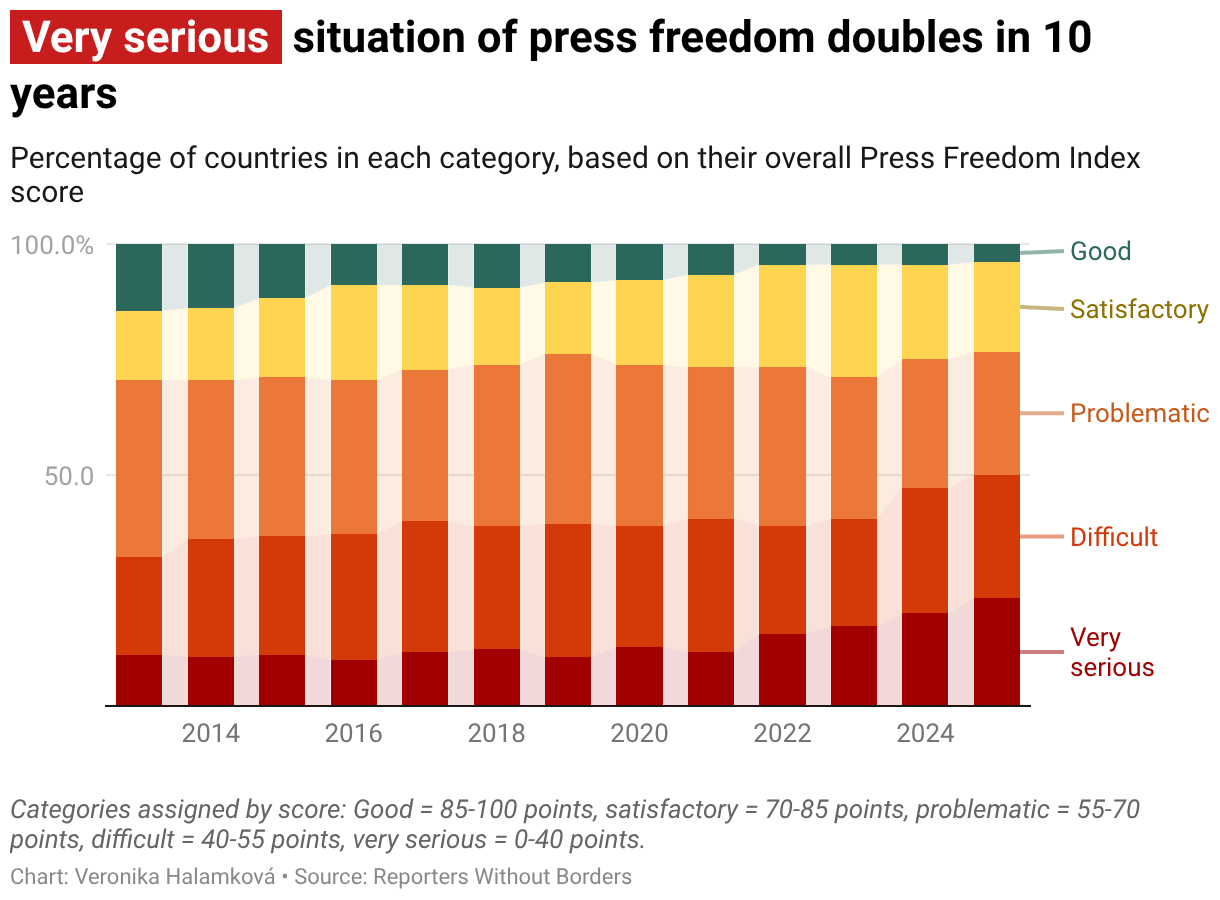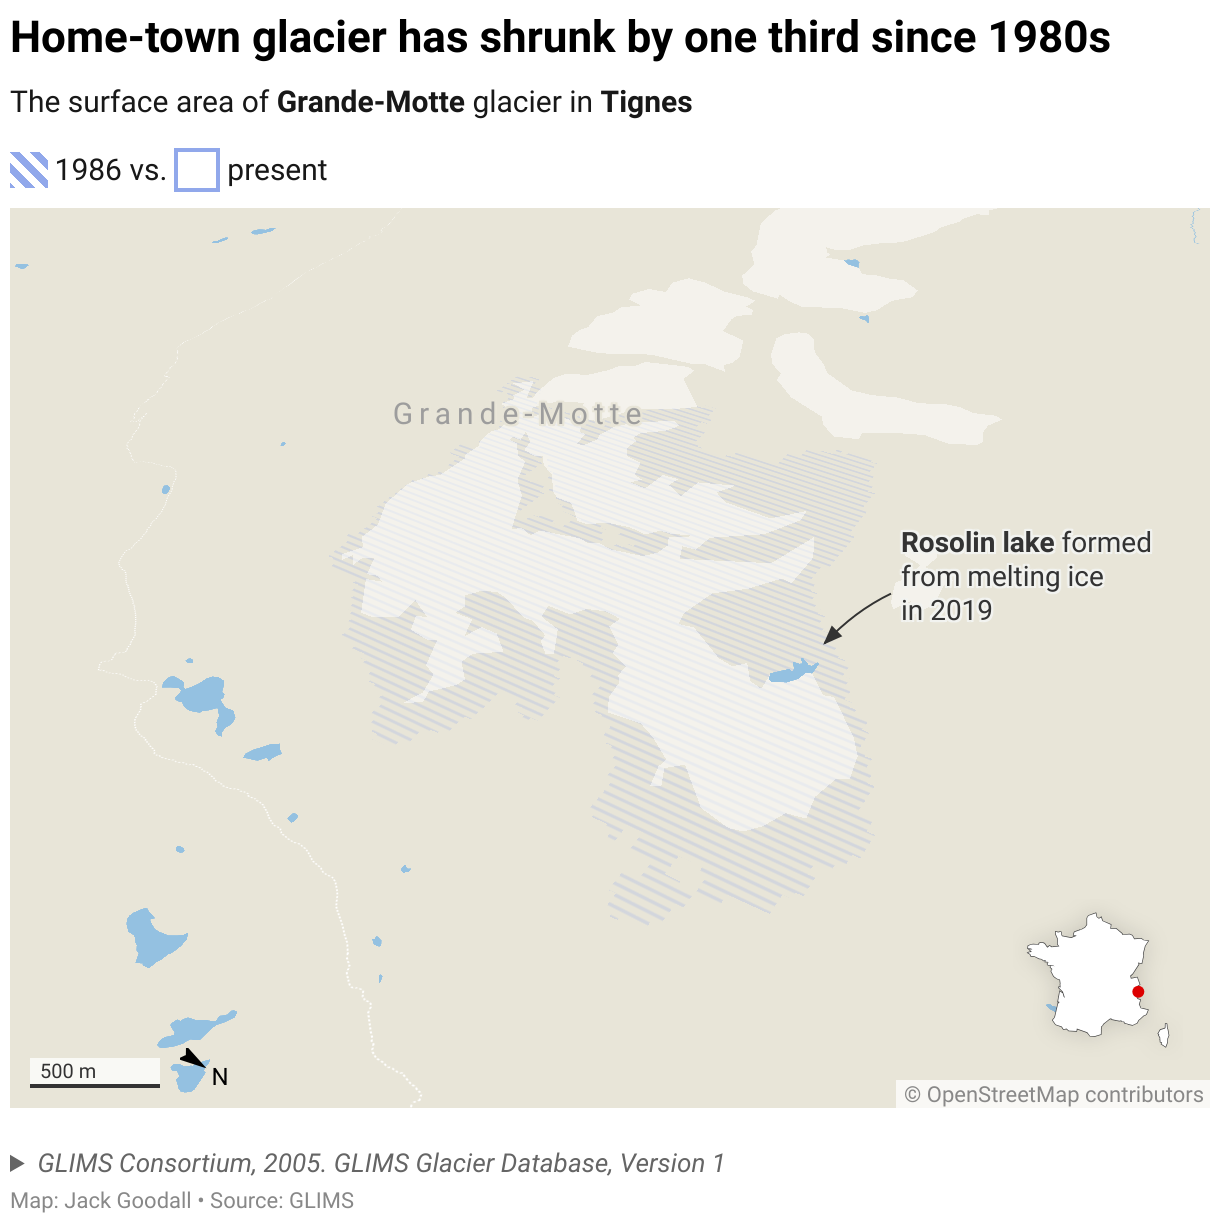

امروز دو نوع نمودار جدید را معرفی می کنیم: نمودارهای آبشاری و نمودارهای دو محوری. هر دو را می توان به عنوان بخشی از ما استفاده کرد جدید طرح کسب و کار. این مقاله در مورد نمودارهای جدید آبشار ما است.
Often used in finance and consulting, waterfall charts are great when you want to communicate changes clearly, whether over time (e.g. revenue changes per month), or as a breakdown across categories (e.g. staffing changes across departments).


Here’s how Datawrapper’s waterfall charts take care of the math, so you can focus on the story:
Automatic colors and calculations
Upload your dataset of differences or running totals, and Datawrapper handles the rest: positive and negative colors are assigned automatically (and can be customized), and differences and totals are calculated and shown in the chart.
Focus on the differences
When dealing with small changes in large values, it can be useful to zoom in on the differences. This allows for a clearer view on the ups and downs.
Datawrapper enables this in one click, along with a choice of two styles: totals shown as points, or as faded-out columns.


When you want to highlight intermediate totals or compare changes across groups, you can add a grouping column to your dataset and enable subtotals. Datawrapper will calculate the totals and insert the intermediate columns automatically.

Show the underlying values
Waterfall charts often show data your audience needs spelled out, not just visualized. That’s why you can decide which value labels are visible (absolute values or percentages), when they’re visible (all the time or only on hover), and where (inside or outside the bars) — whatever works best for your data.

Whatever you choose, Datawrapper automatically prevents labels from overlapping, so your chart always looks clean and legible — on any device, at any size.
All the power of annotations for context and explanation
If you’ve used Datawrapper before, you already know our powerful annotations — and you’ll find them in waterfall charts too. They’re great for highlighting specific data points or adding context and explanations.
You can place text annotations wherever you need them, change their font size and color, and turn on pointer lines. To put the focus on specific areas in your chart, add reference lines and range highlights.
Everything else you’re used to
Besides the special options we’ve pointed out here, all the Datawrapper features you’re used to work with waterfall charts, too: dark mode; PNG, SVG, and PDF export; responsive mobile support; automatic descriptions for screen readers and keyboard controls for interactive elements; multilingual support, including right-to-left languages; and custom themes.
Get started with waterfall charts
To try out the new Datawrapper waterfall charts — even if you’re not on the Business plan — hover over any of the examples in this article and click “Edit this chart.” You can also open a demo in our chart type selector, directly in Datawrapper.
To learn more about waterfall charts, we’d also like to invite you to:
Thanks to everyone who worked on this feature: Ivan Lokhov (project lead), Alexander Käßner (lead designer), Elliot Bentley, Luc Guillemot, Moritz Kuhn, David Wendler, and Elana Levin Schtulberg.
We hope you enjoy creating waterfall charts in Datawrapper. If you have any questions or feedback, don’t hesitate to reach out to our team at support@datawrapper.de.